2025 Texas Flash Flood
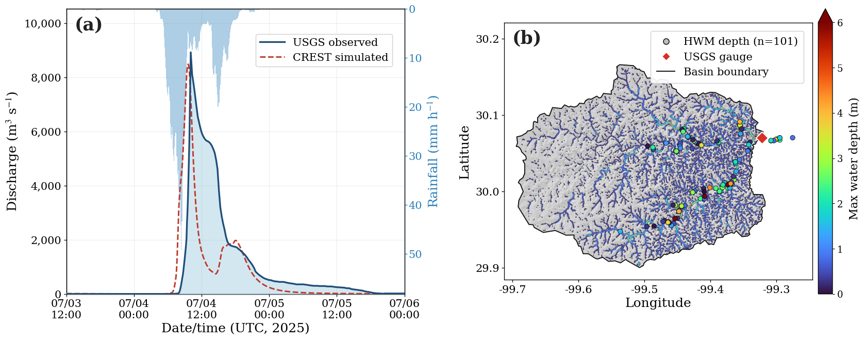
CREST reproduced the observed USGS discharge hydrograph for the July 2025 Texas flash flood and mapped peak water depths against 101 high‑water marks across the basin.
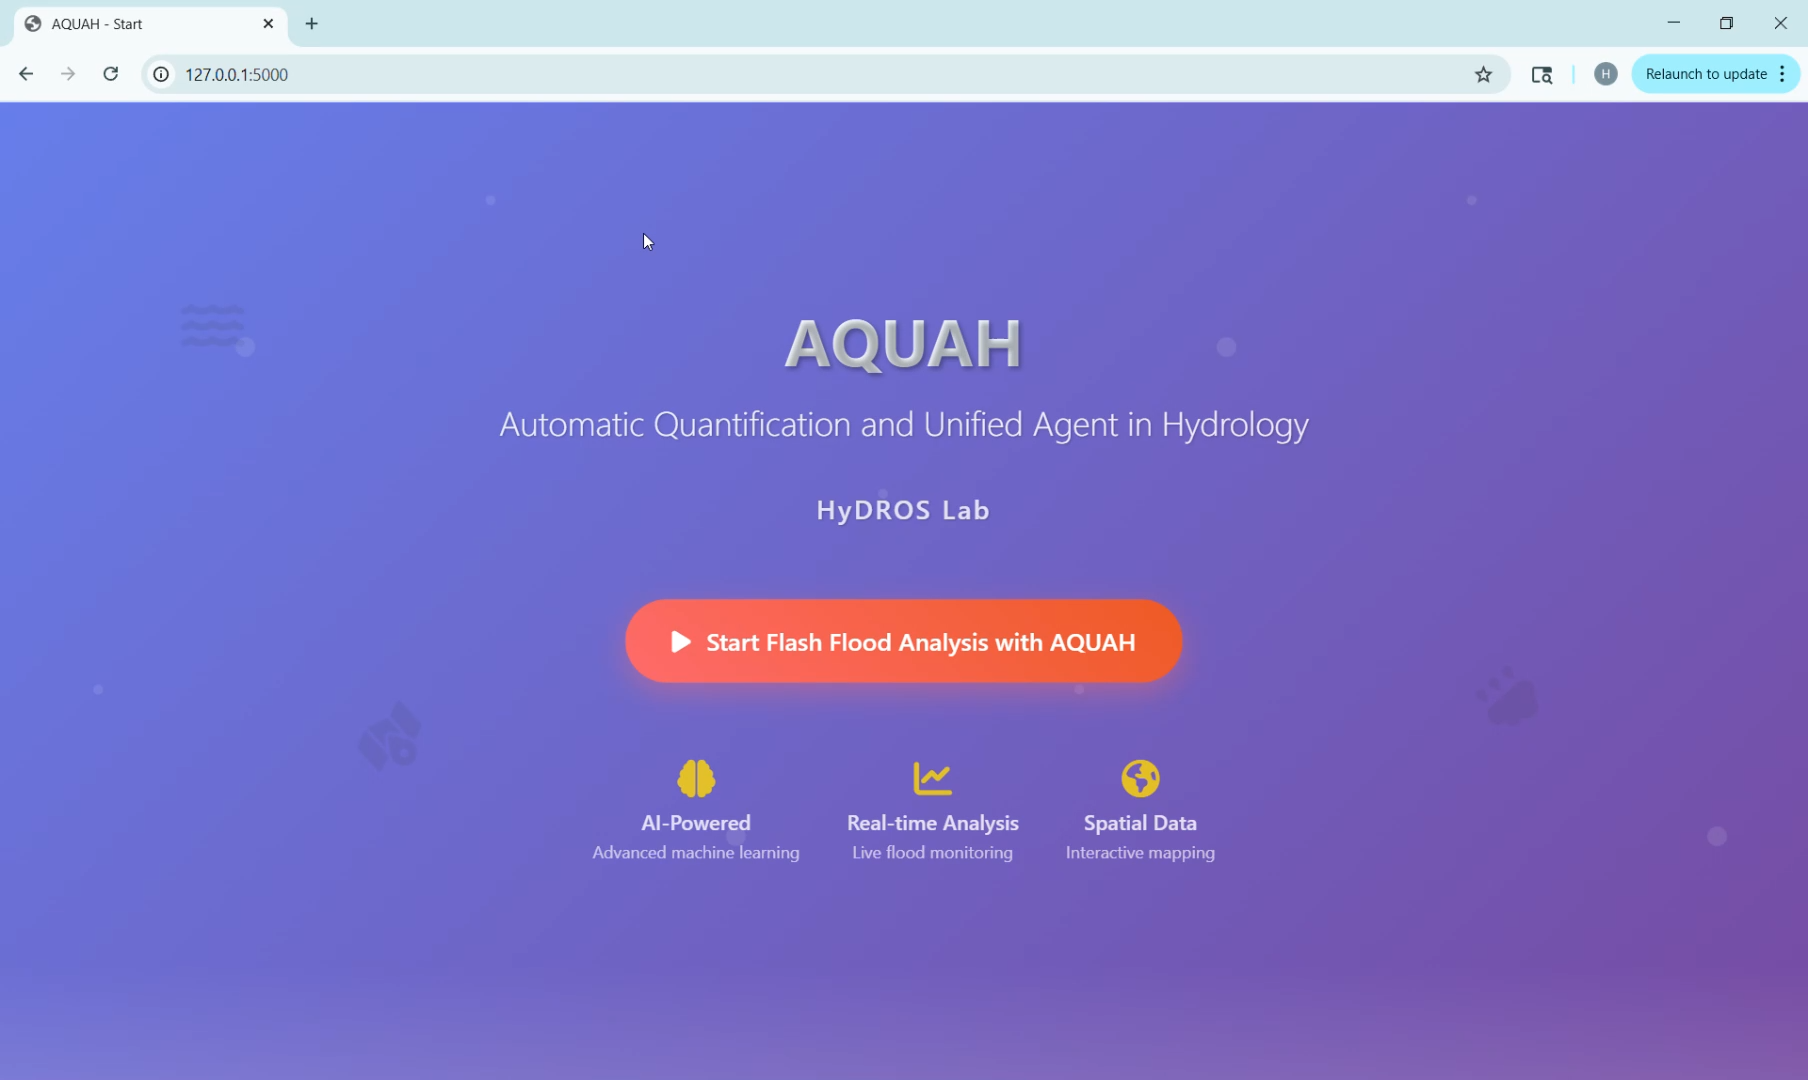
Describe a flood in plain language — “flood in Kerrville, Texas, July 2025” — or pick USGS gauges on the map, and watch the CREST/EF5 model simulate it in real time: 2‑D streamflow, live hydrographs, and AI calibration.
New to CREST‑AI? A quick introduction to the agentic flood dashboard.
An interactive history: model structure, milestones, global reach, and the model family tree. Auto‑plays — use the arrows to navigate.
From real‑time warnings to long‑term planning, HydroSky adapts to your data and decisions.
High‑resolution rainfall ingestion (MRMS/HRRR), hydrologic routing with CREST/EF5, probabilistic peaks, and push alerts with explainable drivers.
Soil‑moisture deficits, runoff efficiency, and snowmelt diagnostics for seasonal allocation, resilience, and supply risk planning.
What‑if storm tracks, displacement correction, reservoir rules, and land‑use change—compare impacts in minutes, not weeks.
Map tiles, time‑series, exceedance curves, and API endpoints for enterprise integration.
Two decades of CREST development — a remote‑sensing–native distributed hydrology stack, now with an AI agent.
Coupled runoff generation — a variable infiltration curve over three soil layers — with cell‑to‑cell flow routing on a grid. Two forcings (precipitation, PET), 17 parameters, 9 outputs; runs at global, regional, or basin scale.
EF5 / FLASH ensemble flash‑flood forecasting, operational at NOAA/NSSL; iCRESLIDE cascading flood–landslide prediction; and CREST‑iMAP, a fully coupled 2‑D hydrologic–hydraulic model for flood inundation mapping (e.g. Hurricane Harvey).
CREST‑VEC vector routing with a lake module for continental‑to‑global runs; a groundwater module (v3.0, CONUS‑wide calibration); and WRF atmosphere coupling toward seamless sensor‑to‑streamflow prediction.
An LLM agent that operates and auto‑calibrates CREST from plain‑language prompts — automating model setup, calibration, and analysis across versions (AQUAH; Yan et al., 2025).
CREST in action on recent high‑impact flood events.
CREST reproduced the observed USGS discharge hydrograph for the July 2025 Texas flash flood and mapped peak water depths against 101 high‑water marks across the basin.
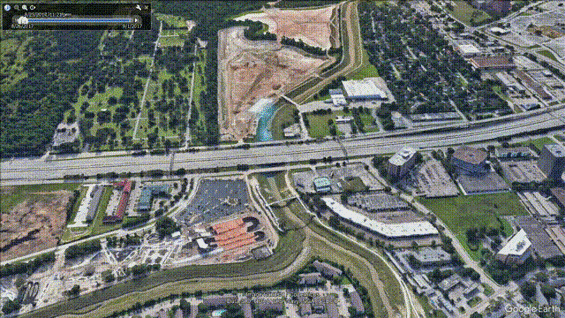
CREST‑iMAP mapped the catastrophic flood inundation across the Houston area during Hurricane Harvey — shown here against Google Earth imagery of the inundated corridor.
Highlights from the HyDROS Lab. See all news ↗






Questions about CREST, collaborations, training, or the CREST‑AI demo? Get in touch.
This site is static — use the email link below or connect a form service later.